

Building 5G Broadcast SFN based on existing T-DAB Broadcast infrastructure
Introduction
One of the key drivers for broadcasters’ and broadcast network providers’ growing interest in adopting 5G Broadcast is making their content available to handheld devices such as mobile phones and tablets.
A critical question is then whether the existing broadcast infrastructure for T-DAB or Digital TV can be used to provide such handheld services.
This case study will attempt, at least partially, to answer this question. The study shall present simulations based on an existing T-DAB network in Denmark. The purpose is to evaluate its ability to provide handheld reception using 5G broadcast 3GPP according to release 16, FeMBMS. We use PROGIRA® plan, the broadcast network planning software, for this study.
T-DAB infrastructure used
The T-DAB Single Frequency Network (SFN) in Denmark can be regarded as a mixture of High Power/High Tower (HPHT) and Medium Power/Medium Tower (MPMT) network. The T-DAB SFN can be characterised as follows:
Number of stations: 58
Transmitter spacing: 30 – 50 km
ERP: 100W – 10 kW
Frequencies: VHF -approximately 200 MHz (Ch11B, 8B and 13B)
Antenna height: 30 – 290m
Polarisation Vertical
The T-DAB network provides indoor coverage to 99.5 % of the population and close to 100% of mobile car reception.
In the simulation, the network was “converted” to UHF channel 37 (602 MHz) using the same antenna heights to provide 5G broadcast coverage. In the conversion to UHF, the ERP was increased by 6 dB to compensate for the more difficult UHF propagation conditions.
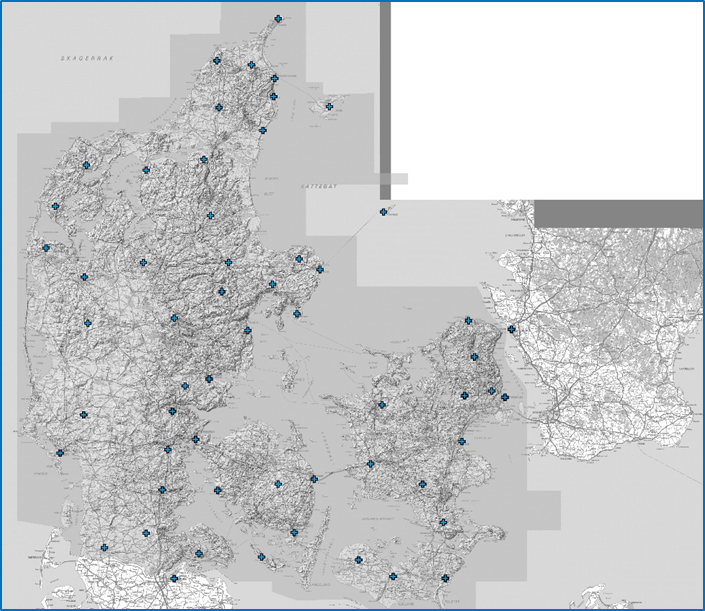
The Danish T-DAB sites used in study. A total of 58 sites.
5G transmission modes and planning parameters
We investigated the application of several different 5G transmission modes, from very robust modes using QPSK, to modes using 256QAM providing high capacity equivalent to DVB-T2 transmissions used today. The transmission modes are:
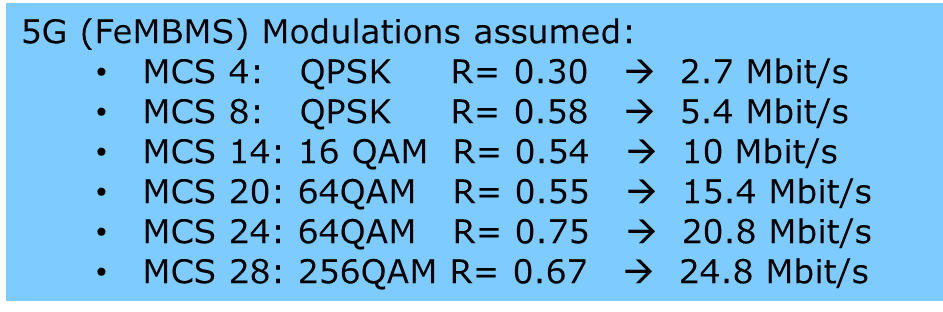
The Cyclic Prefix (Guard Interval) was set to 300 µs with the corresponding symbol time of 2700 us. Additionally, we conducted a verification using a CP of 200 µs to evaluate the impact using a shorter guard interval.
The bandwidth (BW) of FeMBMS signal is set to 8 MHz. Since this BW does not exist in the 3GPP standard release 16, we simulated the scenario by using two adjacent blocks with 5 and 3 MHz bandwidth respectively. We chose the 8 MHz bandwidth to allow easy comparison with DVB-T2/ATSC 3.0.
Handheld terminals at 1.5 meters antenna height with a receiving antenna gain of -6 dBi, has been assumed. For estimation of indoor coverage, a building entry loss of 8 dB was applied with a 5.5 dB spread, which is slightly more stringent than the least strict value given in ITU-R Rec. BT. 2033. Therefore, we were evaluating a relatively optimistic indoor case scenario, and not considering urban buildings with thick concrete walls or buildings using metallised windows.
When assessing coverage, the possible impact of the CAS (Cell Acquisition Subframe) in FeMBMS was not considered. To allow the receiver to correctly interpret the Broadcast content, the CAS in FeMBMS needs to be received and decoded. The CAS should in theory be very robust, but there are currently some uncertainties regarding how well the CAS will perform in real cases.
Planning software and databases
To access coverage, the PROGIRA® plan planning software with the 5G broadcast module was used. The field strength calculation was made using the CRC-Predict terrain-based propagation model. The propagation model was tuned to the clutter and height data in Denmark using field measurement data. The following geographical databases were used:
- Terrain Elevation data (25m resolution)
- Clutter data (50m resolution)
- Population data (100m resolution)
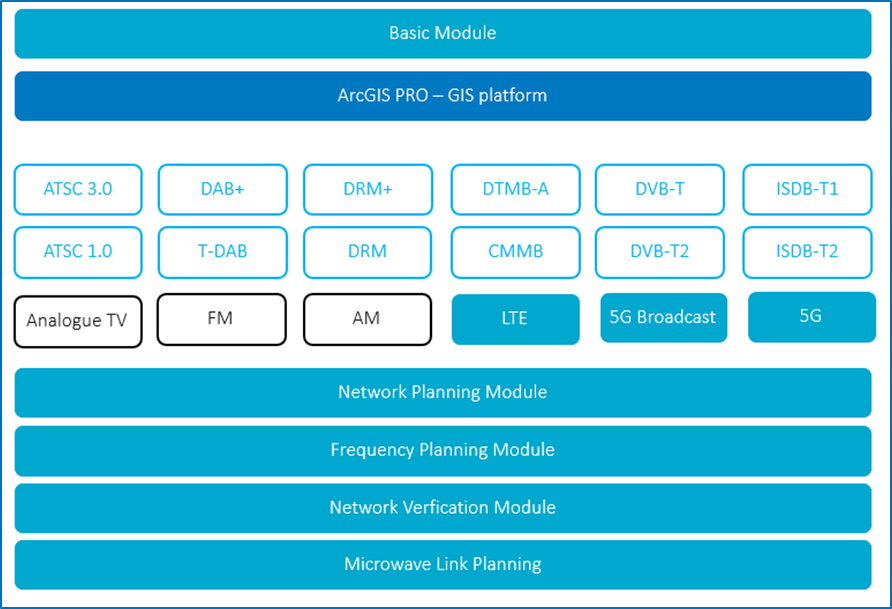
Structure of the PROGIRA® plan RF planning software. Map handling is done in ESRI ArcMap 10.8, or ArcGisPro 2.5.
Handheld indoor coverage
To start, the C/(N+I) for the network was calculated. A polynomial approximation based on the LTE system performance has been used to map the C/(N+I) values to capacity.
Presented below is the raw achievable capacity, i.e. without taking the CP prefix and receiver properties into account.
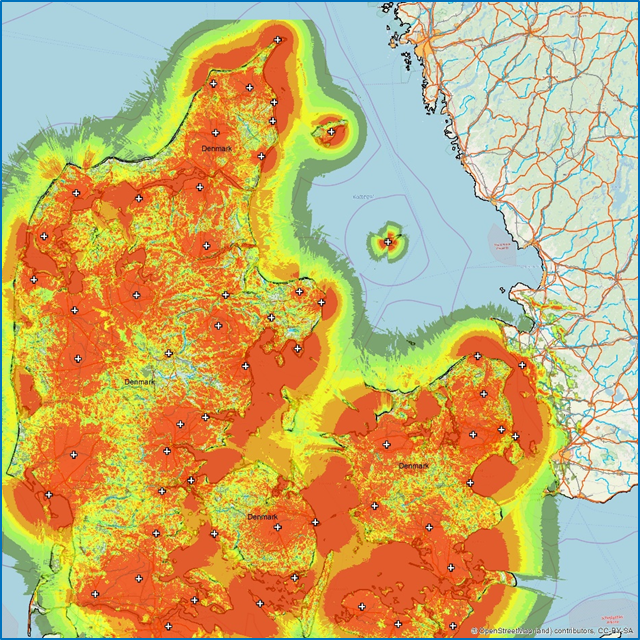
Median (50% of locations) Raw achievable capacity
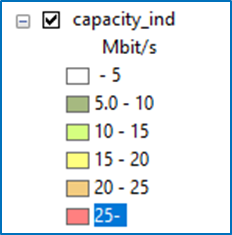
In the map, it seems that it is possible to provide a capacity over 25 Mbit/s in a large part of the country. It should however be kept in mind that this is the median capacity, valid only for 50% of locations. For broadcast services, we normally use a target service probability of 95% of locations. Besides, we need to be able to evaluate the impact of possible SFN self-interference in the network, which will have an impact on the results. This is particularly important for the less robust MODCODs (MCS) in LTE.
By running SFN simulations for the different FeMBMS system variants we get the following population coverage figures:
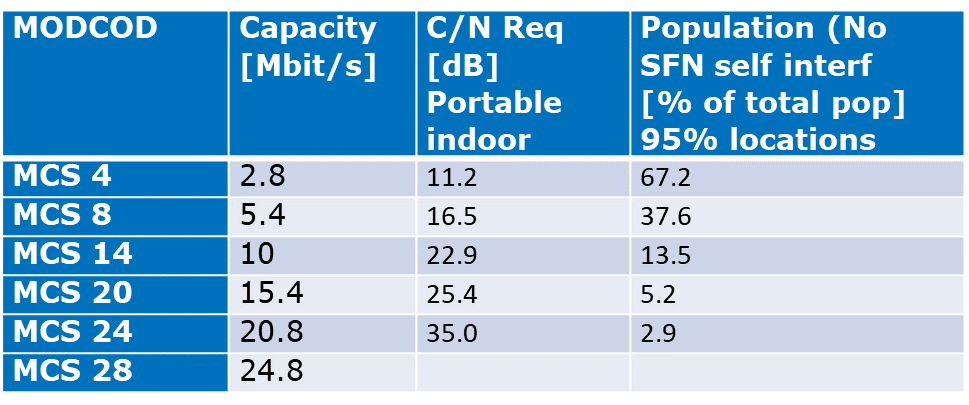
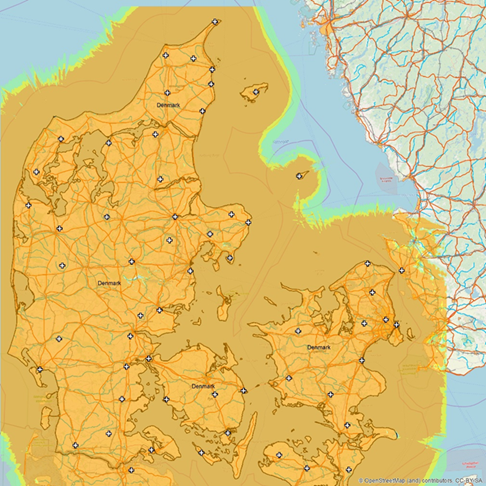
Table 1: Population coverage for 95% of locations for different MCS. The coverage plot for MCS 24 and 04 presented below.
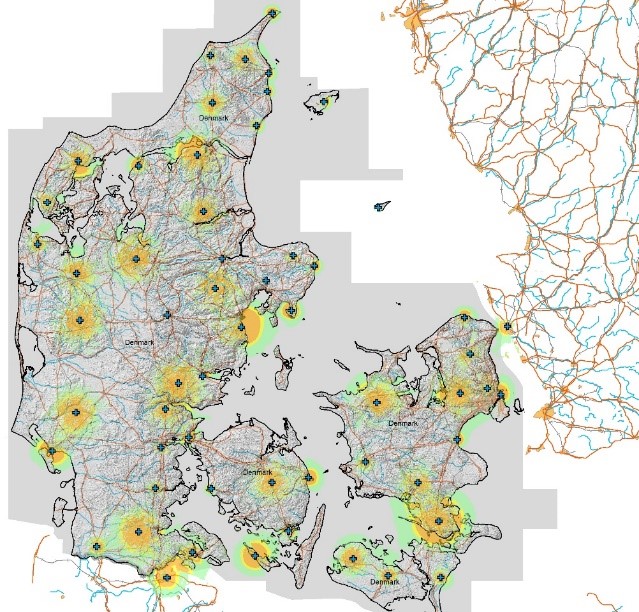
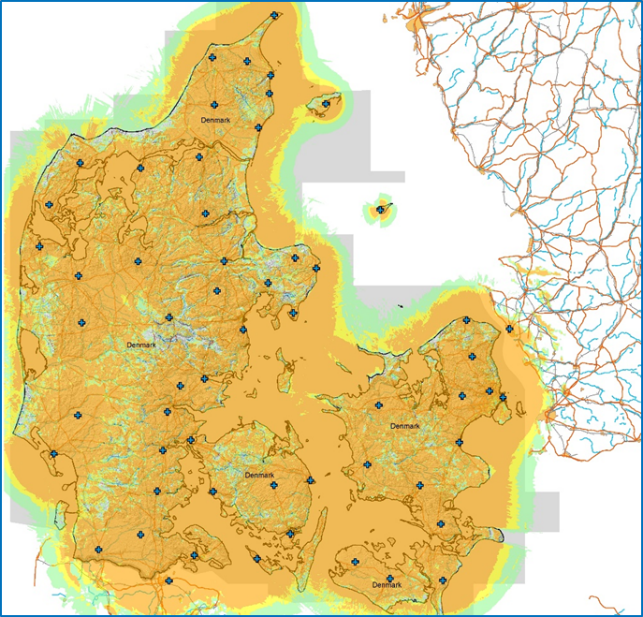
Coverage for MCS 24 and 04 providing 20 and 2.8 Mbit/s. Population coverage is about 3% and 67% respectively.
We conclude that it might be difficult to provide a capacity of above about 3 Mbit/s for handheld indoor terminals. If the target is to achieve a population coverage of above 90%, additional infrastructure will be needed.
Handheld outdoor coverage
If we do the same calculation for a handheld outdoor terminal, the results improve significantly. The table below compares the results with the handheld indoor coverage:
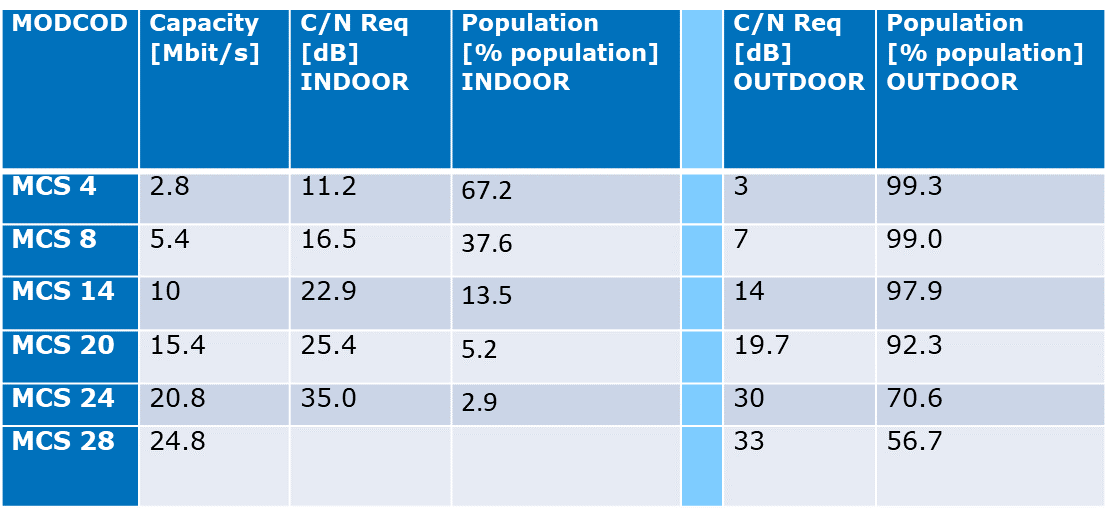
Table 2: Comparing population coverage for handheld indoor and outdoor coverage
From the outdoor results, we see that it would be possible to deliver approximately 10-15 Mbit/s to about 95% of the population.
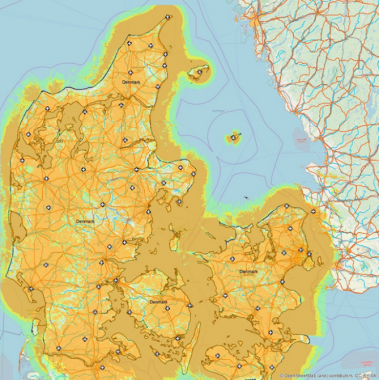
Coverage for MCS 14 providing 10 Mbit/s and MCS 24 providing close to 21 Mbit/s
From Table 2 above, it can be seen that there is a large difference between the C/N assumed for portable indoor and portable outdoor. The values are taken from 5G XCast deliverable 3.1. The reason for the large difference is the different channel models used for the two cases. The models used in 5G-X cast are based on measurements in different environments. In the case of portable outdoor, a channel model with a direct path combined with a number of scattered paths was used; while the portable indoor paths are more critical and use only reflections, no direct path was used.
It remains yet to be seen how well these relate to the average receiving situation, indoors or outdoors.
The study used currently available 5G Broadcast planning parameters, which seem to indicate a significant loss in performance when compared to the existing DVB-T2 and ATSC 3.0 systems. One reason for this “degraded” performance might be the current lack of time and frequency interleaving in FeMBMS, 3GPP release 16 for 5G Broadcast.
Comparison coverage for T-DAB at VHF and FeMBMS at UHF
Based on the previous results when assessing coverage for FeMBMS, we compared to the results with the T-DAB coverage at VHF.
Table 3 shows a link budget comparison for the two cases:
- Propagation should theoretically be about 9.5 dB better at 200 MHz, when compared to 600 MHz
- Power at FeMBMS – UHF network was increased by 7 dB relative to T-DAB
- Antenna gain differs by 2 dB (-6 dBd vs. -8 dBd). It should be noted that the T-DAB network is planned for mobile service using an external antenna. For a handheld T-DAB service the antenna gain would be much worse
- The two systems use different bandwidths which gives an advantage for T-DAB of about 7 dB.
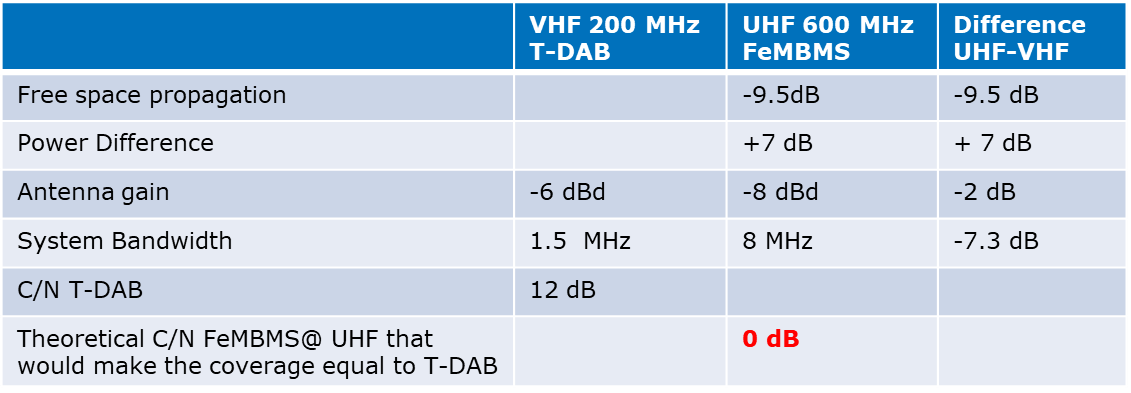
Table 3: Comparison between the Link budgets for T-DAB at 200 MHz and FeMBMS at 600 MHz
The comparison shows that a C/N of 0 dB for FeMBMS would provide roughly the same population coverage as for T-DAB (>99.5%). This seems to be in the right order, since a C/N of 3 dB for FeMBMS gives a population coverage of 99.3%. It seems realistic to assume that a C/N of 0dB would provide a population coverage of about 99.5% or more.
Conclusions
By comparing the results from different cyclic prefix, i.e. 30µs and 200µs, it becomes clear that a cyclic prefix of 300 µs is needed in this SFN. When usinga cyclic prefix of 200µs the limitation from SFN self-interference would be large.
Regarding the capacity provided, we conclude that it won’t be straightforward to provide high capacity handheld indoor reception using existing broadcast infrastructure. For handheld indoor reception, the capacity provided would be limited to about 3-4 Mbit/s, which is at least further away from the transmitters. While targeting handheld outdoor or mobile reception it would be possible to provide acceptable reception quality to up to approximately 10-15 Mbit/s. To provide higher capacity, additional infrastructure is required, which will inevitably increase the transmission cost. Cooperation with an MNO (Mobile Network Operator), or at least access to a LPLT infrastructure would be an advantage.
Broadcasters need to consider their business cases in relation to 5G broadcast carefully.