
PROGIRA plan Version 7.0.2 release notes
9th September 2019
This is a minor upgrade which mainly consists of minor changes and bug fixes.
Highlights:
- Use of shapefiles in PROGIRA plan with ArcGIS Pro version
- Job List window
- Thresholds in Network Sum Setup
- External rasters in population and area coverage
- Network Verification Module Upgrades
What’s New?
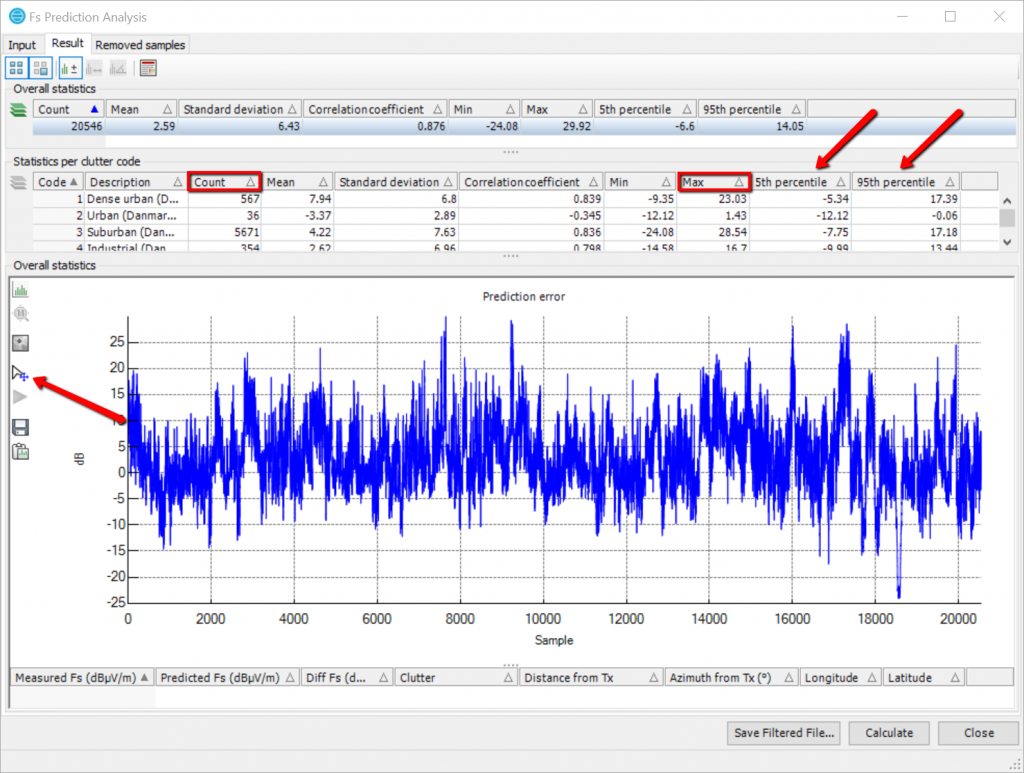
FS Prediction Analysis in Network Verification Module
- The statistical percentile values for 5 % and 95 % has been added to the result tables.
- A graph function named “Select datapoint on mouse move” has been added. If you activate this function you need to click with the left mouse button on the graph to present the corresponding value in the table under the graph. If not activated the values are presented while moving the cursor along the graph.
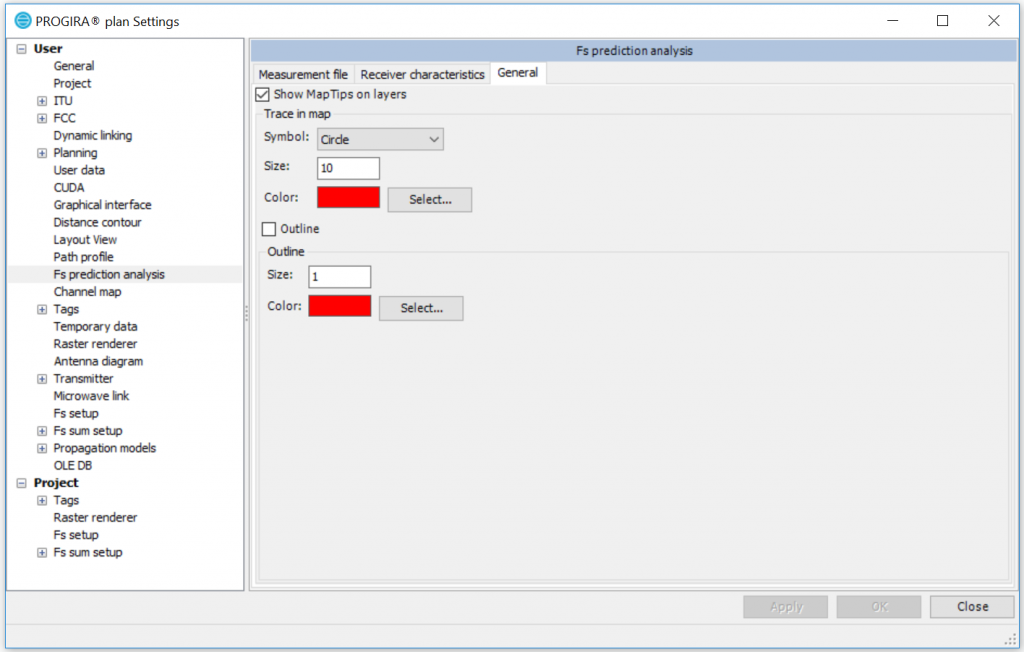
Settings for FS Prediction analysis in Network Verification Module
- One graph function makes it possible to trace the measurement points on the map. You can now modify the measurement trace symbol in the PROGIRA® plan Settings menu
Request for a complete release notes?
Need a Version Upgrade?
Contact us or simply submit a request form.